The power of summarization
The Summary Grid and Summary Table are two of my favorite MAXQDA features. These tools are valuable for summarizing your coded data, making it easier to draw insights from it. They enhance your analytical capabilities, regardless of whether you are working with qualitative, mixed methods, or any other form of data.
Once you have carefully read and coded your data in MAXQDA, you will find an extensive offering of analytical tools you can utilize next. The choice—of course—depends on your research goals and questions.
Suppose your goals include summarizing the content of your coded data segments. In that case, the Summary Grid and Summary Table are excellent features that streamline condensing those code-worthy text, image, or media segments into focused summaries. These summaries are then compiled in the Grid or displayed alongside document variables in Summary Tables, simplyfing extracting and synthesizing critical data across documents.
The Summary Grid: A comprehensive overview

The Summary Grid is your go-to tool for summarizing coded data on a case-by-case basis. You can find it under the “Analysis” main menu.
You can use this feature to compile all the coded segments for a specific topic or code, allowing you to see the big picture at a glance. For example, suppose you analyze statements coded with “Less/no overtime” from a respondent named Riley. In that case, the Summary Grid will display all relevant coded segments and provide a space to summarize them.
This process involves more than simply aggregating content. It involves interpreting the data through the lens of your research questions. Researchers primarily write summaries in their own voices rather than just paraphrasing data. This analytical approach ensures summaries are empirically grounded yet theoretically rich.
How to summarize data using the Summary Grid
When using the Summary Grid for the first time, begin by activating a smaller number of documents and codes. This will generate a grid where each row represents a document, and each column represents a code. Cells will display a blue node only if the code occurs in the corresponding document.
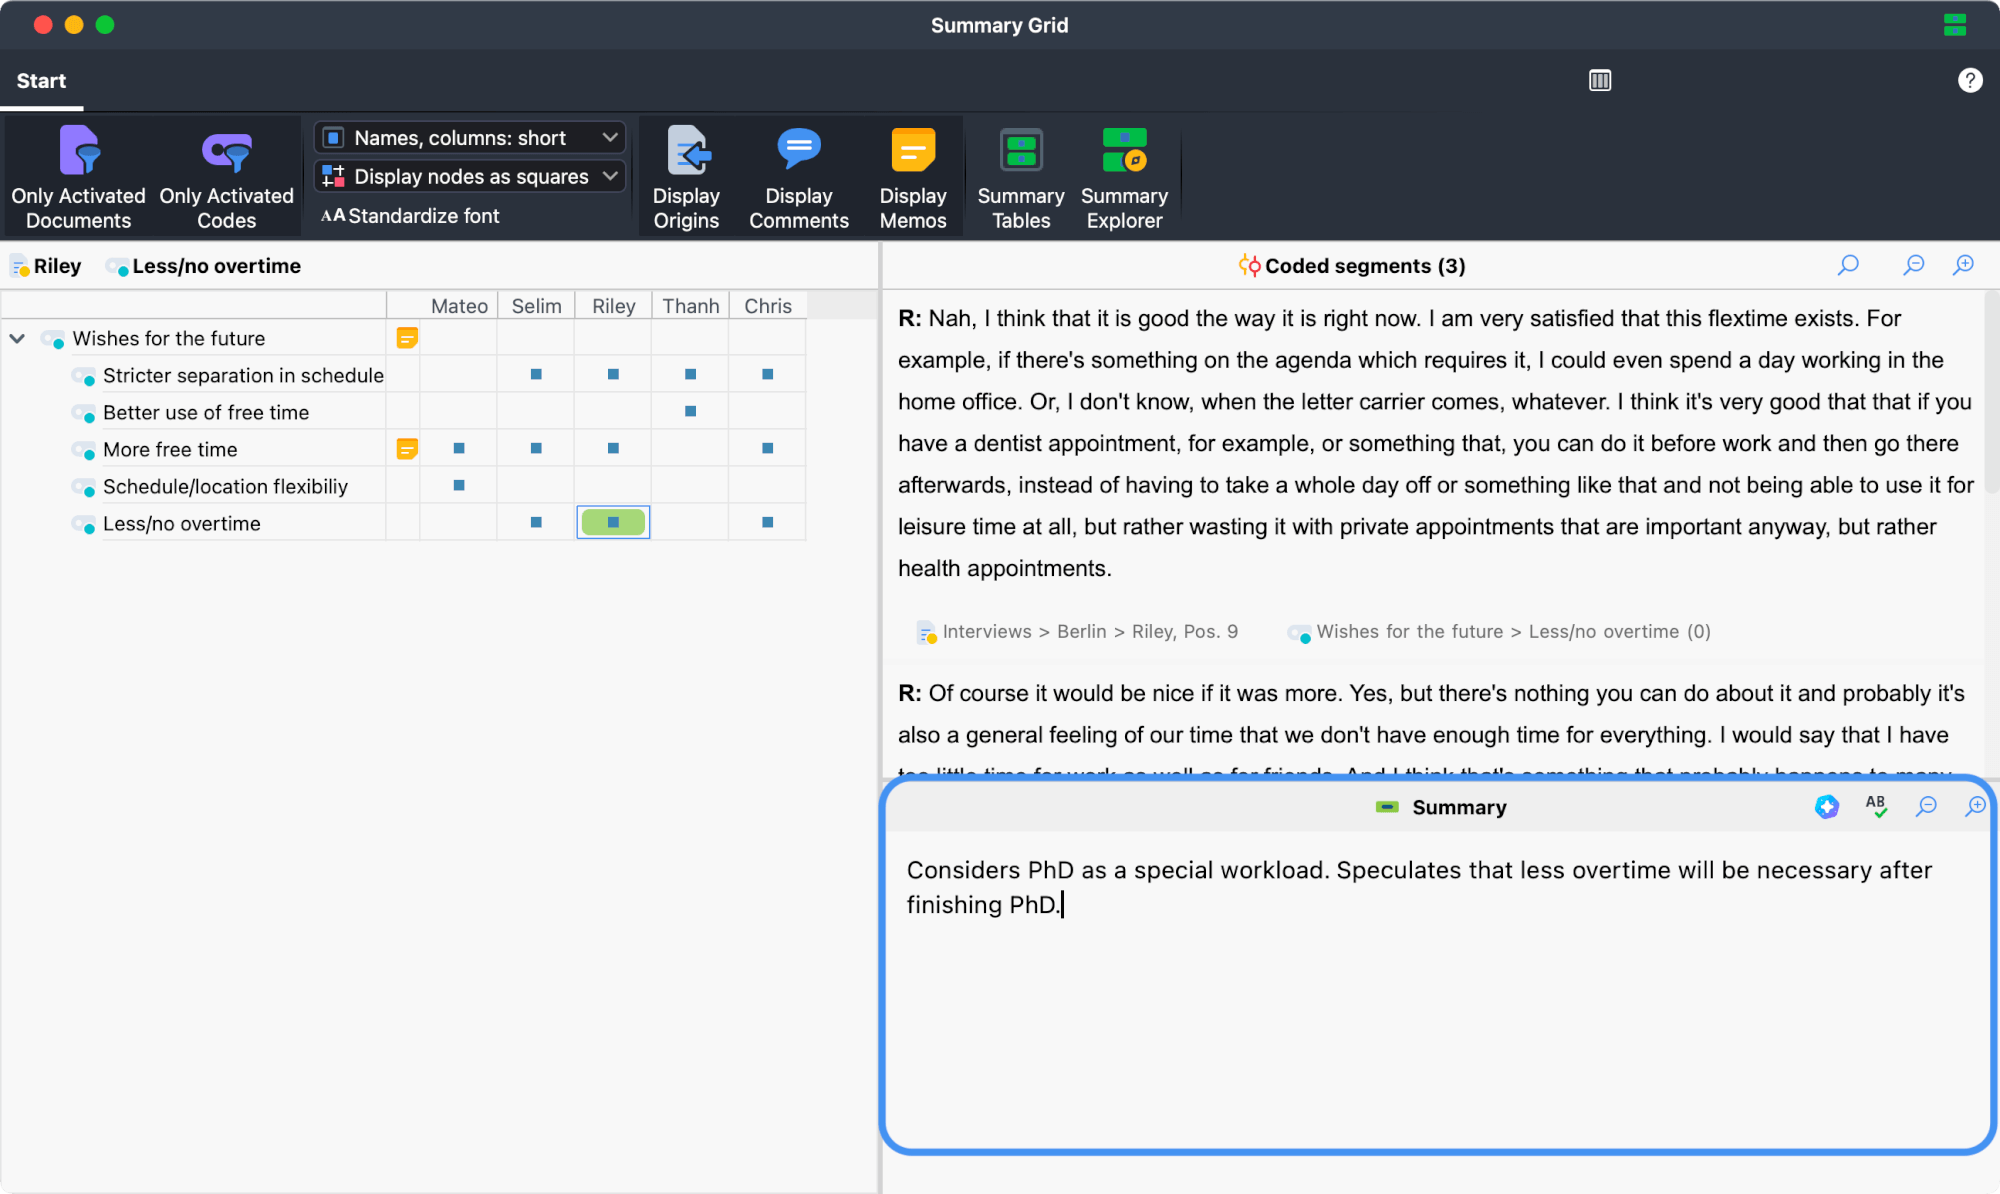
When you click on one of the blue nodes, you display all segments coded with the respective code within that document in the upper right-hand panel of the workspace. In addition, the empty “Summary” panel opens, inviting you to fill it with a summary of the original data.
After writing a summary for this code-by-document cell, MAXQDA adds a green background behind the cell’s blue node to indicate that a summary exists for that pairing.
Creating automatic summaries with AI Assist

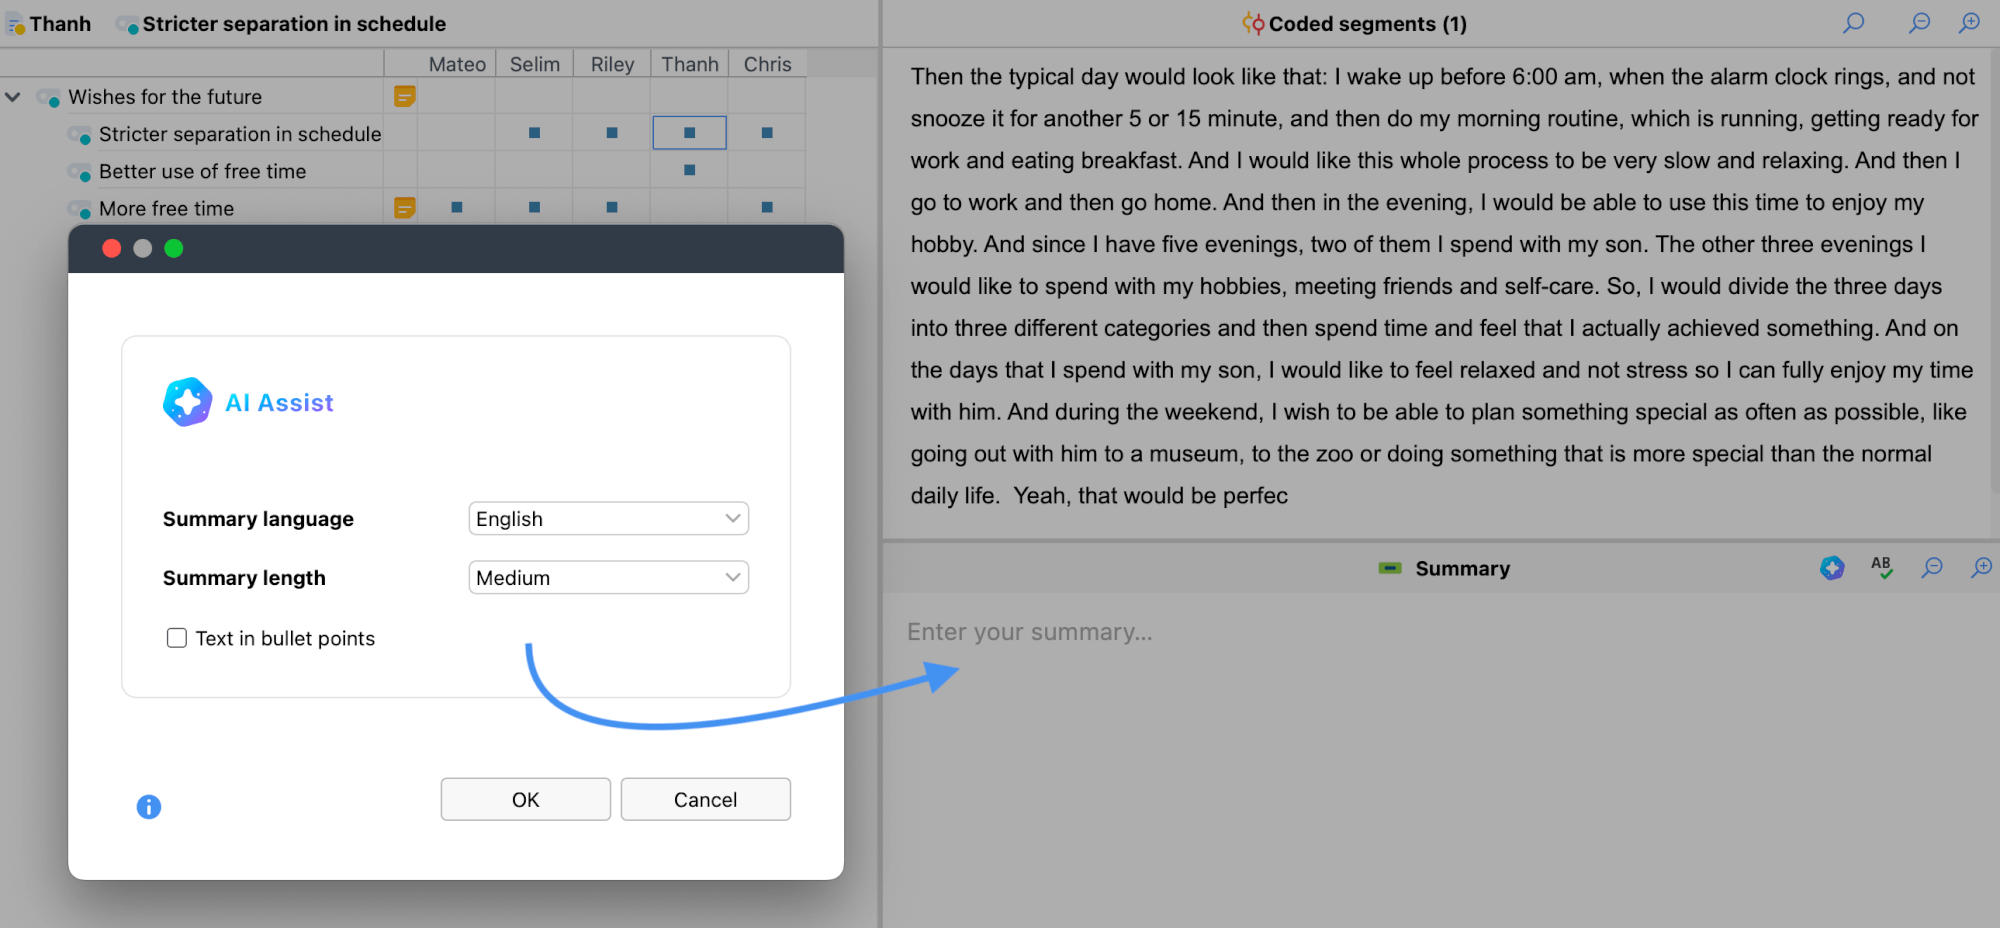
The AI Assist add-on (optionally available for MAXQDA 24) can facilitate this process by automatically generating summaries directly within the Summary Grid.
This feature is particularly useful when working with large data sets, as it significantly reduces the time and effort required when summarizing manually. You can then review and modify the AI-generated summary to reflect the data accurately. To use this AI Assist feature, click on the AI icon in the summary field toolbar.
The Summary Table: Customizable summary compilations

Summary Tables are powerful tools for compiling and presenting summaries created in the Summary Grid.
These customizable tables can combine summaries, document variables, and codes for selected documents and themes. They are the ideal workspace for case- or theme-based analysis. Summary Tables are instrumental when preparing for a presentation or publication, providing a way to organize and structure research findings.
How to create a Summary Table
You can open the Summary Tables workspace from within the Summary Grid window or from the “Analysis” tab. After clicking New Summary Table, a dialog will open where you can select which documents (all or currently activated documents) and codes to include in your Summary Table. In the second tab, you also have the option to select variables, such as demographic data, to display alongside your summaries.

The Summary Table will then open. It is structured to display each selected document in a row, whereas the columns represent one of the selected codes or variables. The cells contain either a variable value (in this example, the age) or the corresponding summary from the Summary Grid for this specific code and document.

This table offers a unique and valuable overview of each case, simplifying the process of comparing cases or writing a case summary for your report. But as usual in MAXQDA—the original data is only one click away. You can toggle each code column to display the original coded segments instead of your summaries when you want to check an original quote.
The Summary Table offers a multitude of additional options like switching rows and columns, displaying document rows in the document color, editing the summary field inline, or summarizing cases or codes via the memo icons in the column headers.
Share your Feedback
If you have never used the Summary Grid before, I encourage you to try it and explore adding a summary layer to your data. As always, we would love to hear any feedback you may have! Happy analyzing, and enjoy uncovering new insights in your research!
About the author

Julia Gerson is Chief Product Manager at MAXQDA, where she focuses on enhancing user experiences and building innovative research tools. With a background in educational science, Julia brings a research-driven approach to her work. As a former Research Fellow with the Marburger Arbeitsgruppe für Methoden & Evaluation (MAGMA), she led multiple projects utilizing MAXQDA. Since 2010, Julia has shared her expertise through numerous workshops and webinars on MAXQDA.
