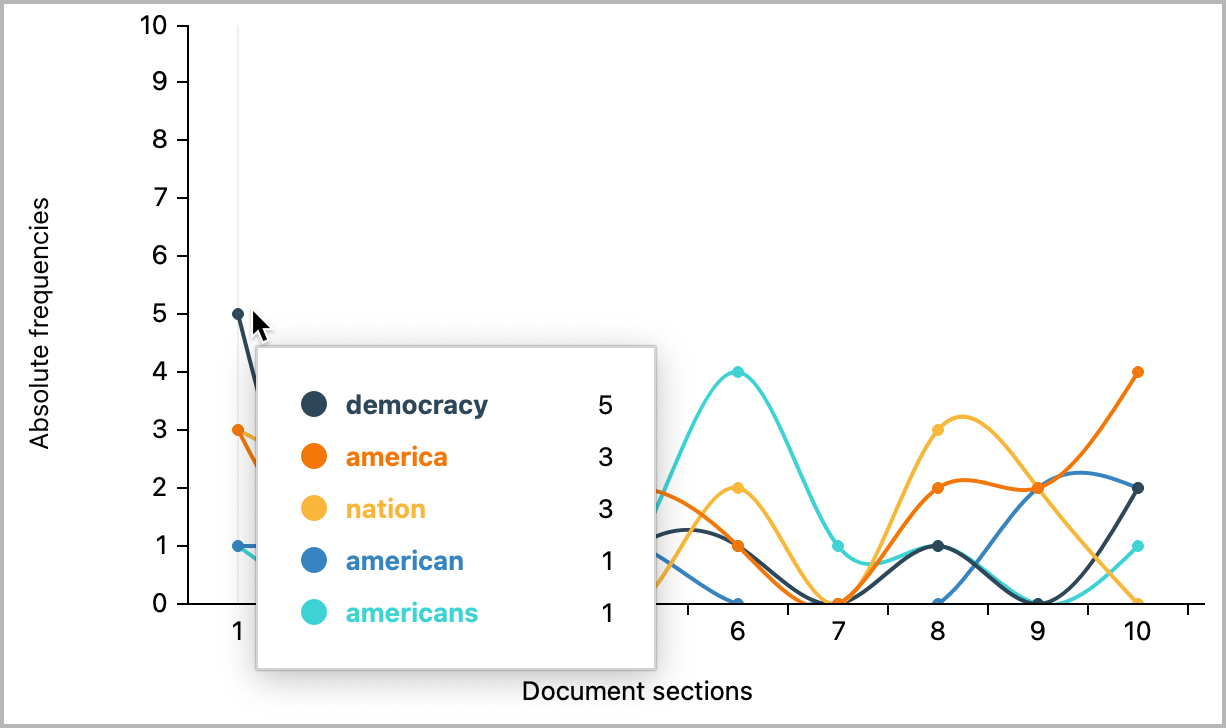
Using Word Trends, you can analyze where and how often words occur in a text. The analyzed text is divided into ten sections of equal length, and the frequency of selected words in each section is visualized in a line chart:

How to use Word Trends
- Open the text document for which you want to analyze Word Trends.
- Select Visual Tools > Word-Trends from the main menu. The Word Trends window will open.
On the left side of the Word Trends window, the most frequent words in the document are listed. On the right side, there is a line chart that visualizes the frequency of the listed words in the sections of the analyzed document.
Add and remove words
To add more words to the analysis, enter the word in the text field above the list of words. If you enter only single letters, all words from the text that start with these letters will be listed for selection.
To remove a listed word, click the red X that appears when you hold the mouse over the word.
Word frequencies
Click on Word Frequencies in the Start menu tab to get a list of all words found in the text and their frequencies.
Options for analysis and presentation
The Start menu tab provides numerous options to customize the analysis and the results display:
- Case Sensitivity – When this option is enabled, Word Trends distinguish between words that are equal except the capitalization of letters.
- Ignore numbers – When this option is enabled, numbers are ignored when listing the most frequent words after opening Word Trends window. Furthermore, numbers cannot be selected for display by entering them in the text field.
- Lemmatize Words – If this option is enabled, all analyzed words are reduced to their base form, i.e., “go”, “went”, and “gone” are considered as the same word (“go”). More information about the lemma lists used can be found here.
- Apply Stopp Word List – If this option is enabled, the words from the currently selected stop word list will be ignored when listing the most frequent words after opening Word Trends window. Furthermore, the excluded words cannot be selected for display by entering them in the text field.
- Scale – Switch between absolute and relative frequencies. Both the absolute and relative frequencies refer to the respective section.
- Sections – Here, you can select the number of sections to be visualized in the Word Trends.
- Colors – Choose between different color schemes for the display.
List search hits
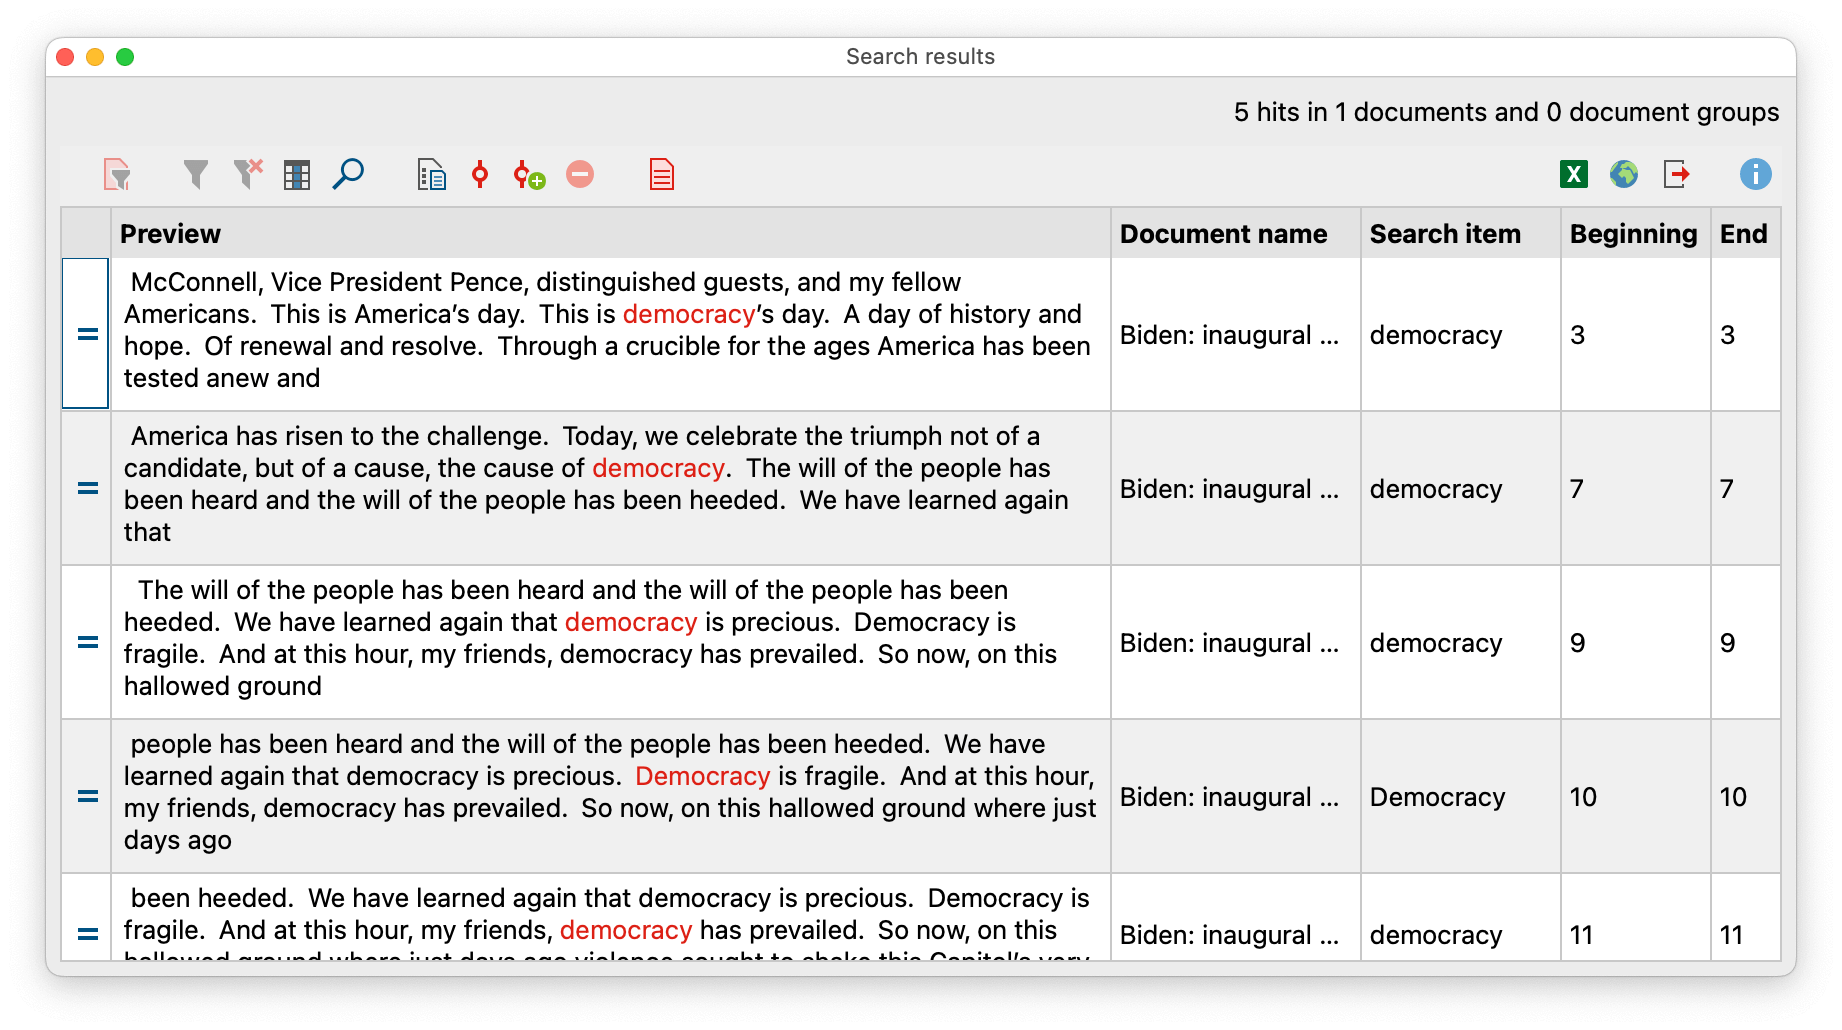
Click on a node in the chart to get a listing of search hits in that section:


Store results in a QTT worksheet
In the Questions – Themes – Theories window of MAXQDA, you can collect and comment on all the important results of your project. In the upper right corner of the Start menu tab of Word Trends, click on the icon ![]() Send to QTT Worksheet, to store the results in a new or existing worksheet. The current display will be saved as an image.
Send to QTT Worksheet, to store the results in a new or existing worksheet. The current display will be saved as an image.
Export and print results
On the top right of the Word Trends window, you will find various options to export the current view, for example, to insert it into your results report:
- Copy Display – Copies the current view to the clipboard so that you can paste Word Trends into a software of your choice, for example, by using Ctrl-/cmd+V.
- Export – Exports the current view as a graphic file.
By clicking on the printer symbol, also at the top right, the current view can be printed directly.
